Insights Dashboard
Delighting Lawyers with a more insightful landing page
Hey there, this is the default text for a new paragraph. Feel free to edit this paragraph by clicking on the yellow edit icon. After you are done just click on the yellow checkmark button on the top right. Have Fun!
Overview
Filevine wanted to offer their users a better way to visualize their data and track it. Currently users had to run reports to see understand their data. But it wasn't visual and it was a pain to run reports for this data.
Certain power users had a Domo integration to be able to visualize their data. But the integration was too expensive for Filevine to offer it to all of their users.
My team was tasked with creating a brand new dashboard experience that would offer all Filevine users insights that would present their data in a visual way. This would help users better understand and consume data about their firm to allow them to make more informed decisions.
Timeline
2021 — 2022
My Role
As the Senior UX Designer I lead and owned the entire UX design process for this project. I conducted user research, created prototypes, did testing, created all of the widget designs, and worked very closely with the Development team through the building process.
The Team
Brittany Keller (me) — Senior UX Designer
Tyler McCan— Product Manager
Austin Knight — Lead Developer
The Task
1. Create a brand new Dashboard experience for Filevine users. This would eventually be the new landing page when users first entered the software, greeting them with insightful widgets and a simple design.
2. Understand what types of widgets and data users would want to see and have access too. Then design all of them out, a library to access them, and a way to customize and configure them.
The Challenges
1. Figuring out what the right amount of user customization was. We wanted users to be able to customize their dashboard screen, but didn't want to give them so much freedom they could give themselve a bad user experience.
2. Navigating a new development process and switching development libraries towards the end of the project.
The Process
Research → Ideate → Test → Design → Develop
Research
Understanding the Problem(s)
Myself and the Product Owner conducted 8 initial discovery interviews with various users, internal employees and our domo integration specialist to understand what the different aspects of this problem.
User Problem
Users want to more easily see and understand the data about their firm cases, employee performace, and finances.
Business Problem
The only way Filevine can offer this to their high-profile firms is through an expensive DOMO integration that is losing them money.
UX Problem
In-order to get their own data in a consumable form, they had to create and run and report that was just a spreadsheet of numbers.
Research
Understanding the User
Filevine's users are attorneys and law staff. These people are often extrememly busy and manage over 200 cases at a time. Our target audience for the initial dashboard widgets were managers. These users like to have their finger on the pulse as to how their staff is doing, what the timeline is on their cases, and how much money their firm is making.
Primary Persona - Manager
These users needed to have easily accessable, digestable, and relevant data about the larger aspects of their firm. They would be looking for the big picture so they can make more informed decisions for money allocation, case intake, and their staff preformance.
Secondary Persona - Firm Staff
These users would be helped during their day to see what phase all of their cases were in, how many open tasks they had, and use the data to see help them orient their workload.
Research
Understanding our Competition
Domo's whole offering is data and data visualization. That is why Filevine was using them. We knew that we couldn't beat them at their own game, but we could give our users something very slimmed down. We knew even this slim offering would absolutely delight the users that didn't already have Domo. But we needed to please the ones that did have domo so it didn't feel like they were getting something taken away.
What our users loved about them:
- Customizable data charts
- Unlimited amount of charts and configurations
- Dig down capabilities
- Cross comparison charts & timelines
- Easy to share and export
Key Concepts to Incorporate
- Customizable and dashboard layout & widget data
- Share & Export functionality
- Visually pleasing
- Easily consumable data visualizations
Ideate
Sketching & Wireframing
Dashboard Sketches
Dashboard Wireframes
Dashboard Wireframes
Dashboard Prototype Screens
Dashboard Wireframes
Hey there, this is the default text for a new paragraph. Feel free to edit this paragraph by clicking on the yellow edit icon. After you are done just click on the yellow checkmark button on the top right. Have Fun!
Testing
Prototype Testing in Person
We were able to show off and test these initial design ideas during Filevine’s legal conference. We asked users to walk through a few flows then give their general feedback about the idea as a whole.
Our Results
1. Generally users were positive and super excited for a feature like this. Everyone who wasn't already using Domo said this was a must-have.
2. Many users gave feedback about wanting tactical widgets like a calendar, task list, and mini feed to add to their dashboard
3. There were concerns about sharing and privacy around firm's private data and not wanting it it be shared with everyone in the firm.
Side Quest
There was so much feedback about incorporating tactical widgets into the dashboards, we couldn't ignore it. We knew it wouldn't be an MVP thing, but there was a huge opportunity for them to help our users and increase this project's offering. We conducted a separate research & design process specifically for these other types of widgets.
Design
Designing the Widgets
Designing the dashboard frame was the easy part. Most of the work had been fleshed out when I designed the prototype. It was just cleaning up and finalizing.
The widgets were the big part of the design phase. We needed to narrow down what widgets we were offering, make them all consistent, and design them so that the date being shown was easily understood and digestable. We landed on 9 different widgets and 5 different types of vizualizations. Plus each had to be designed in 4 different sizes to make them customizable. All together that equals 180 widget designs.
Final Widget Designs
Final Screen Designs
Dashboard Home Screen
Widget Customization Panel
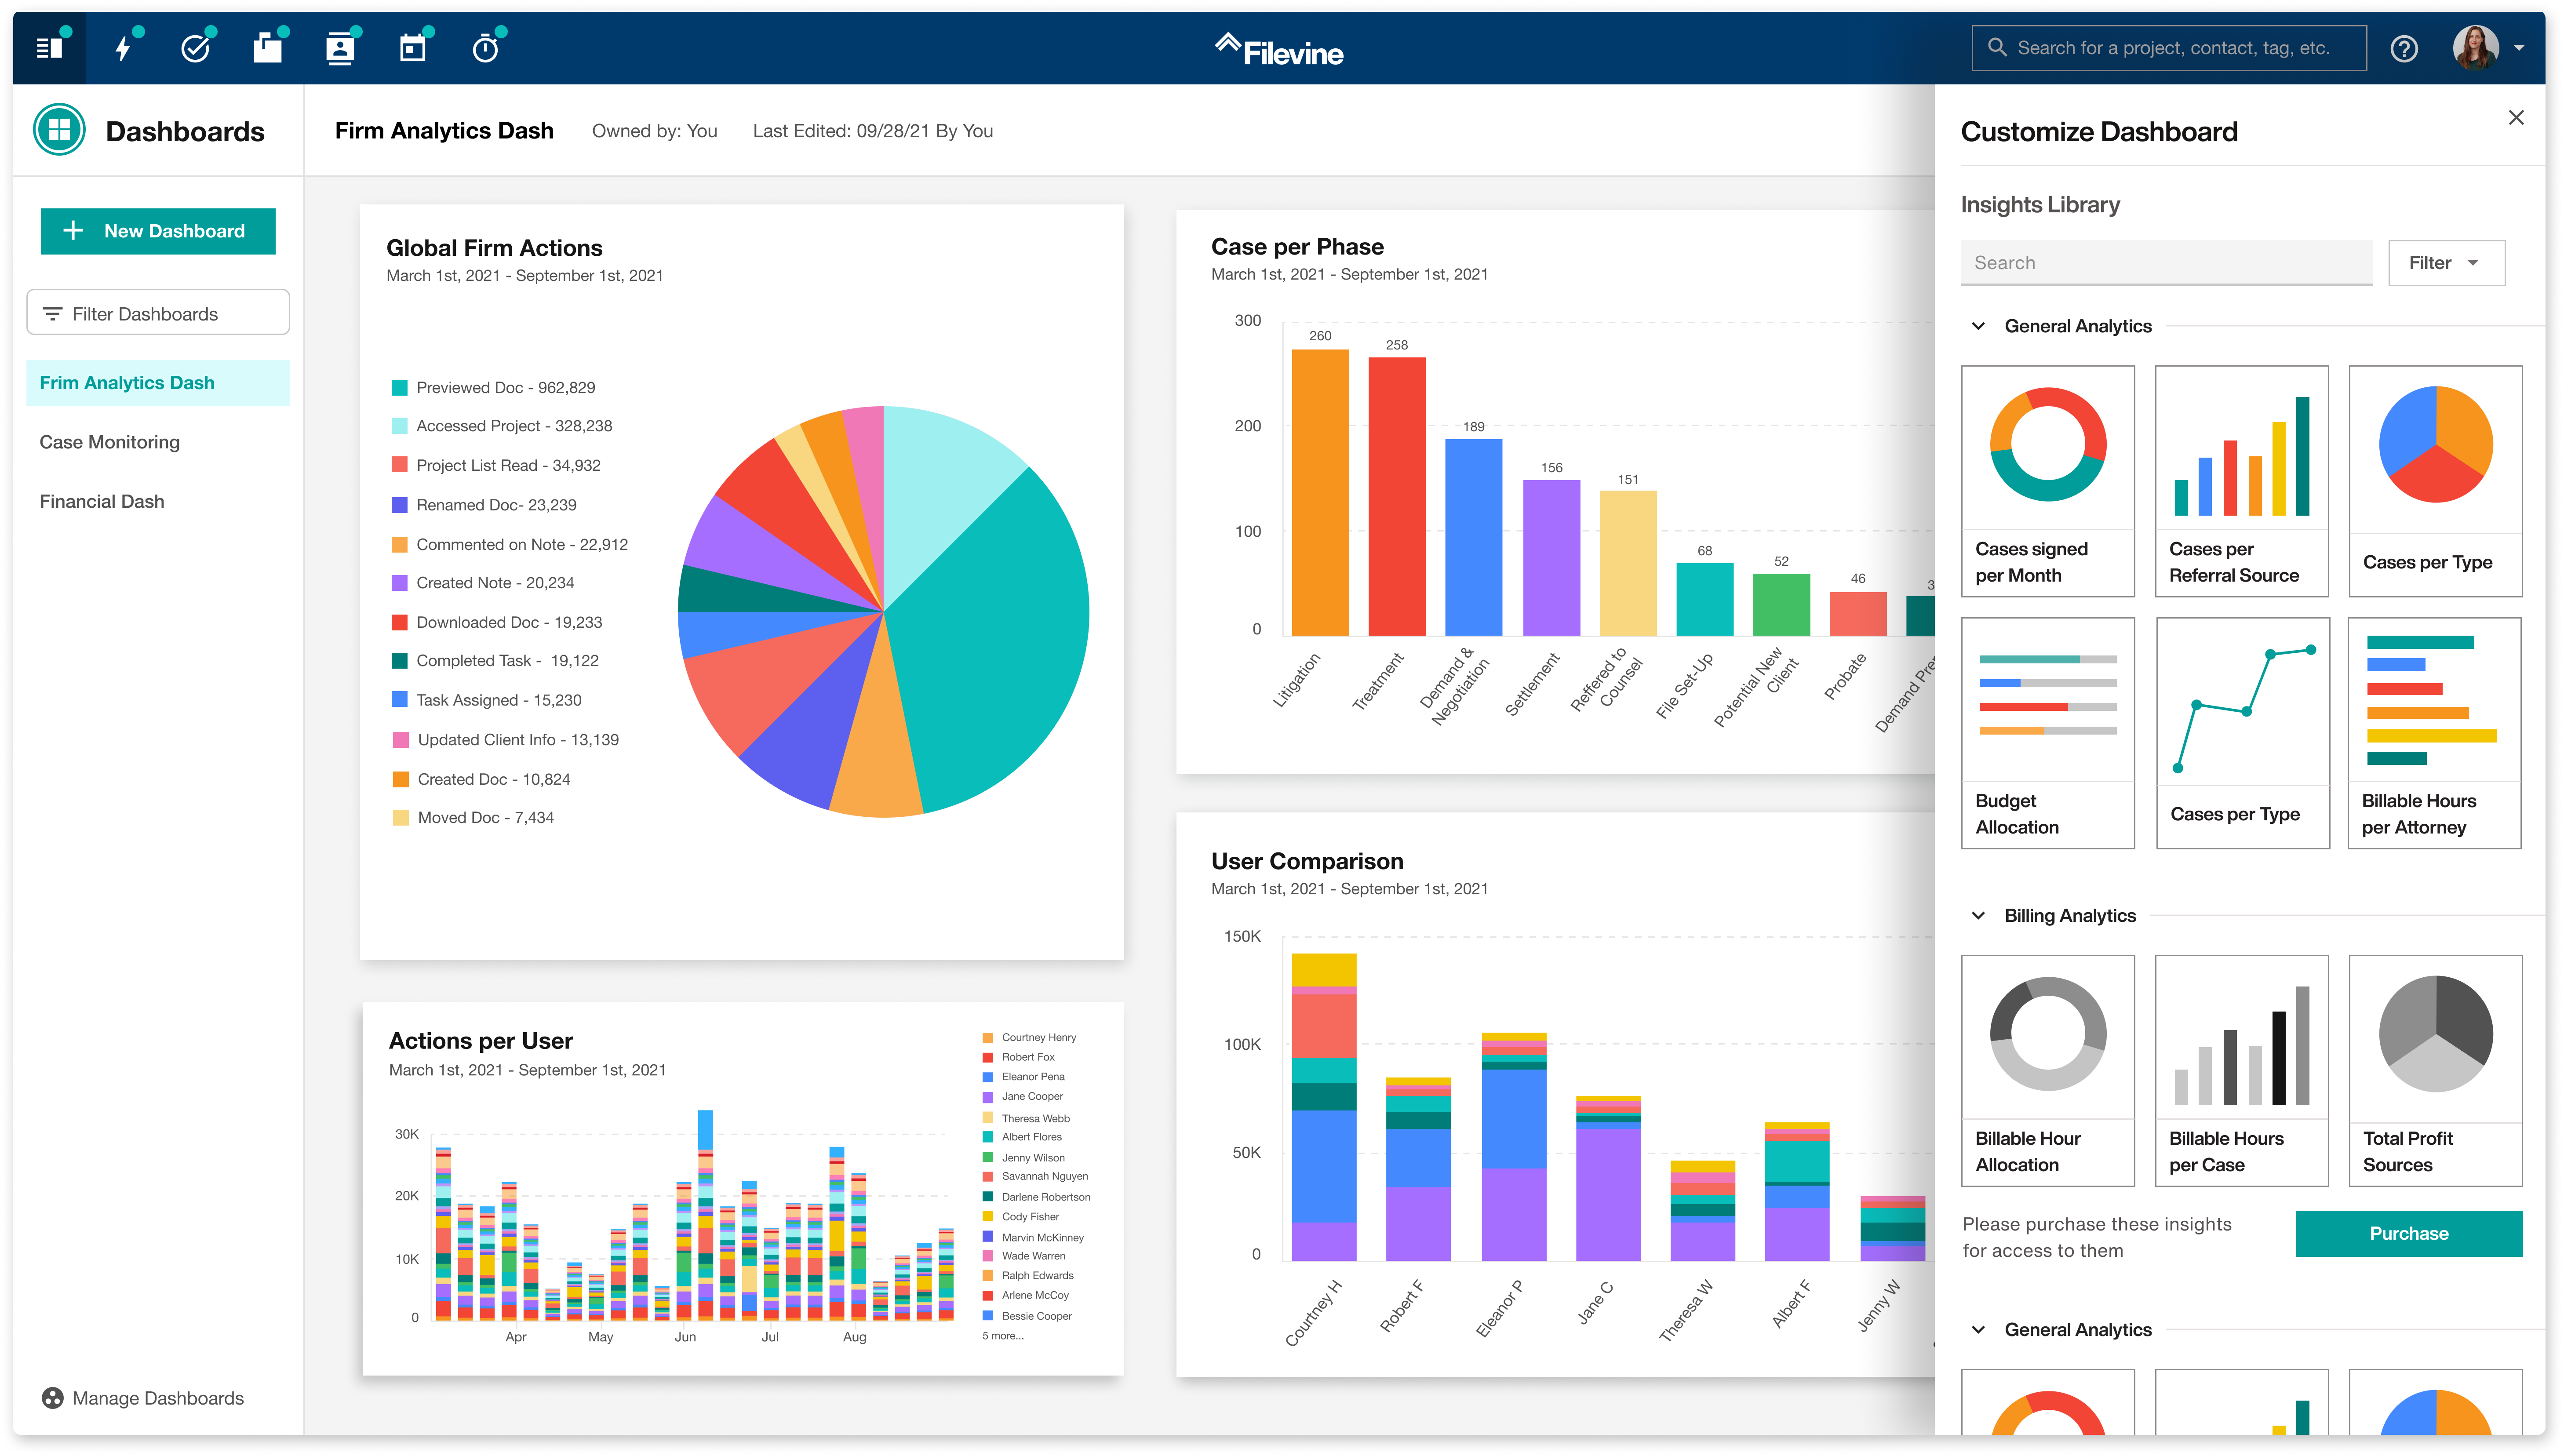
Widget Library Panel
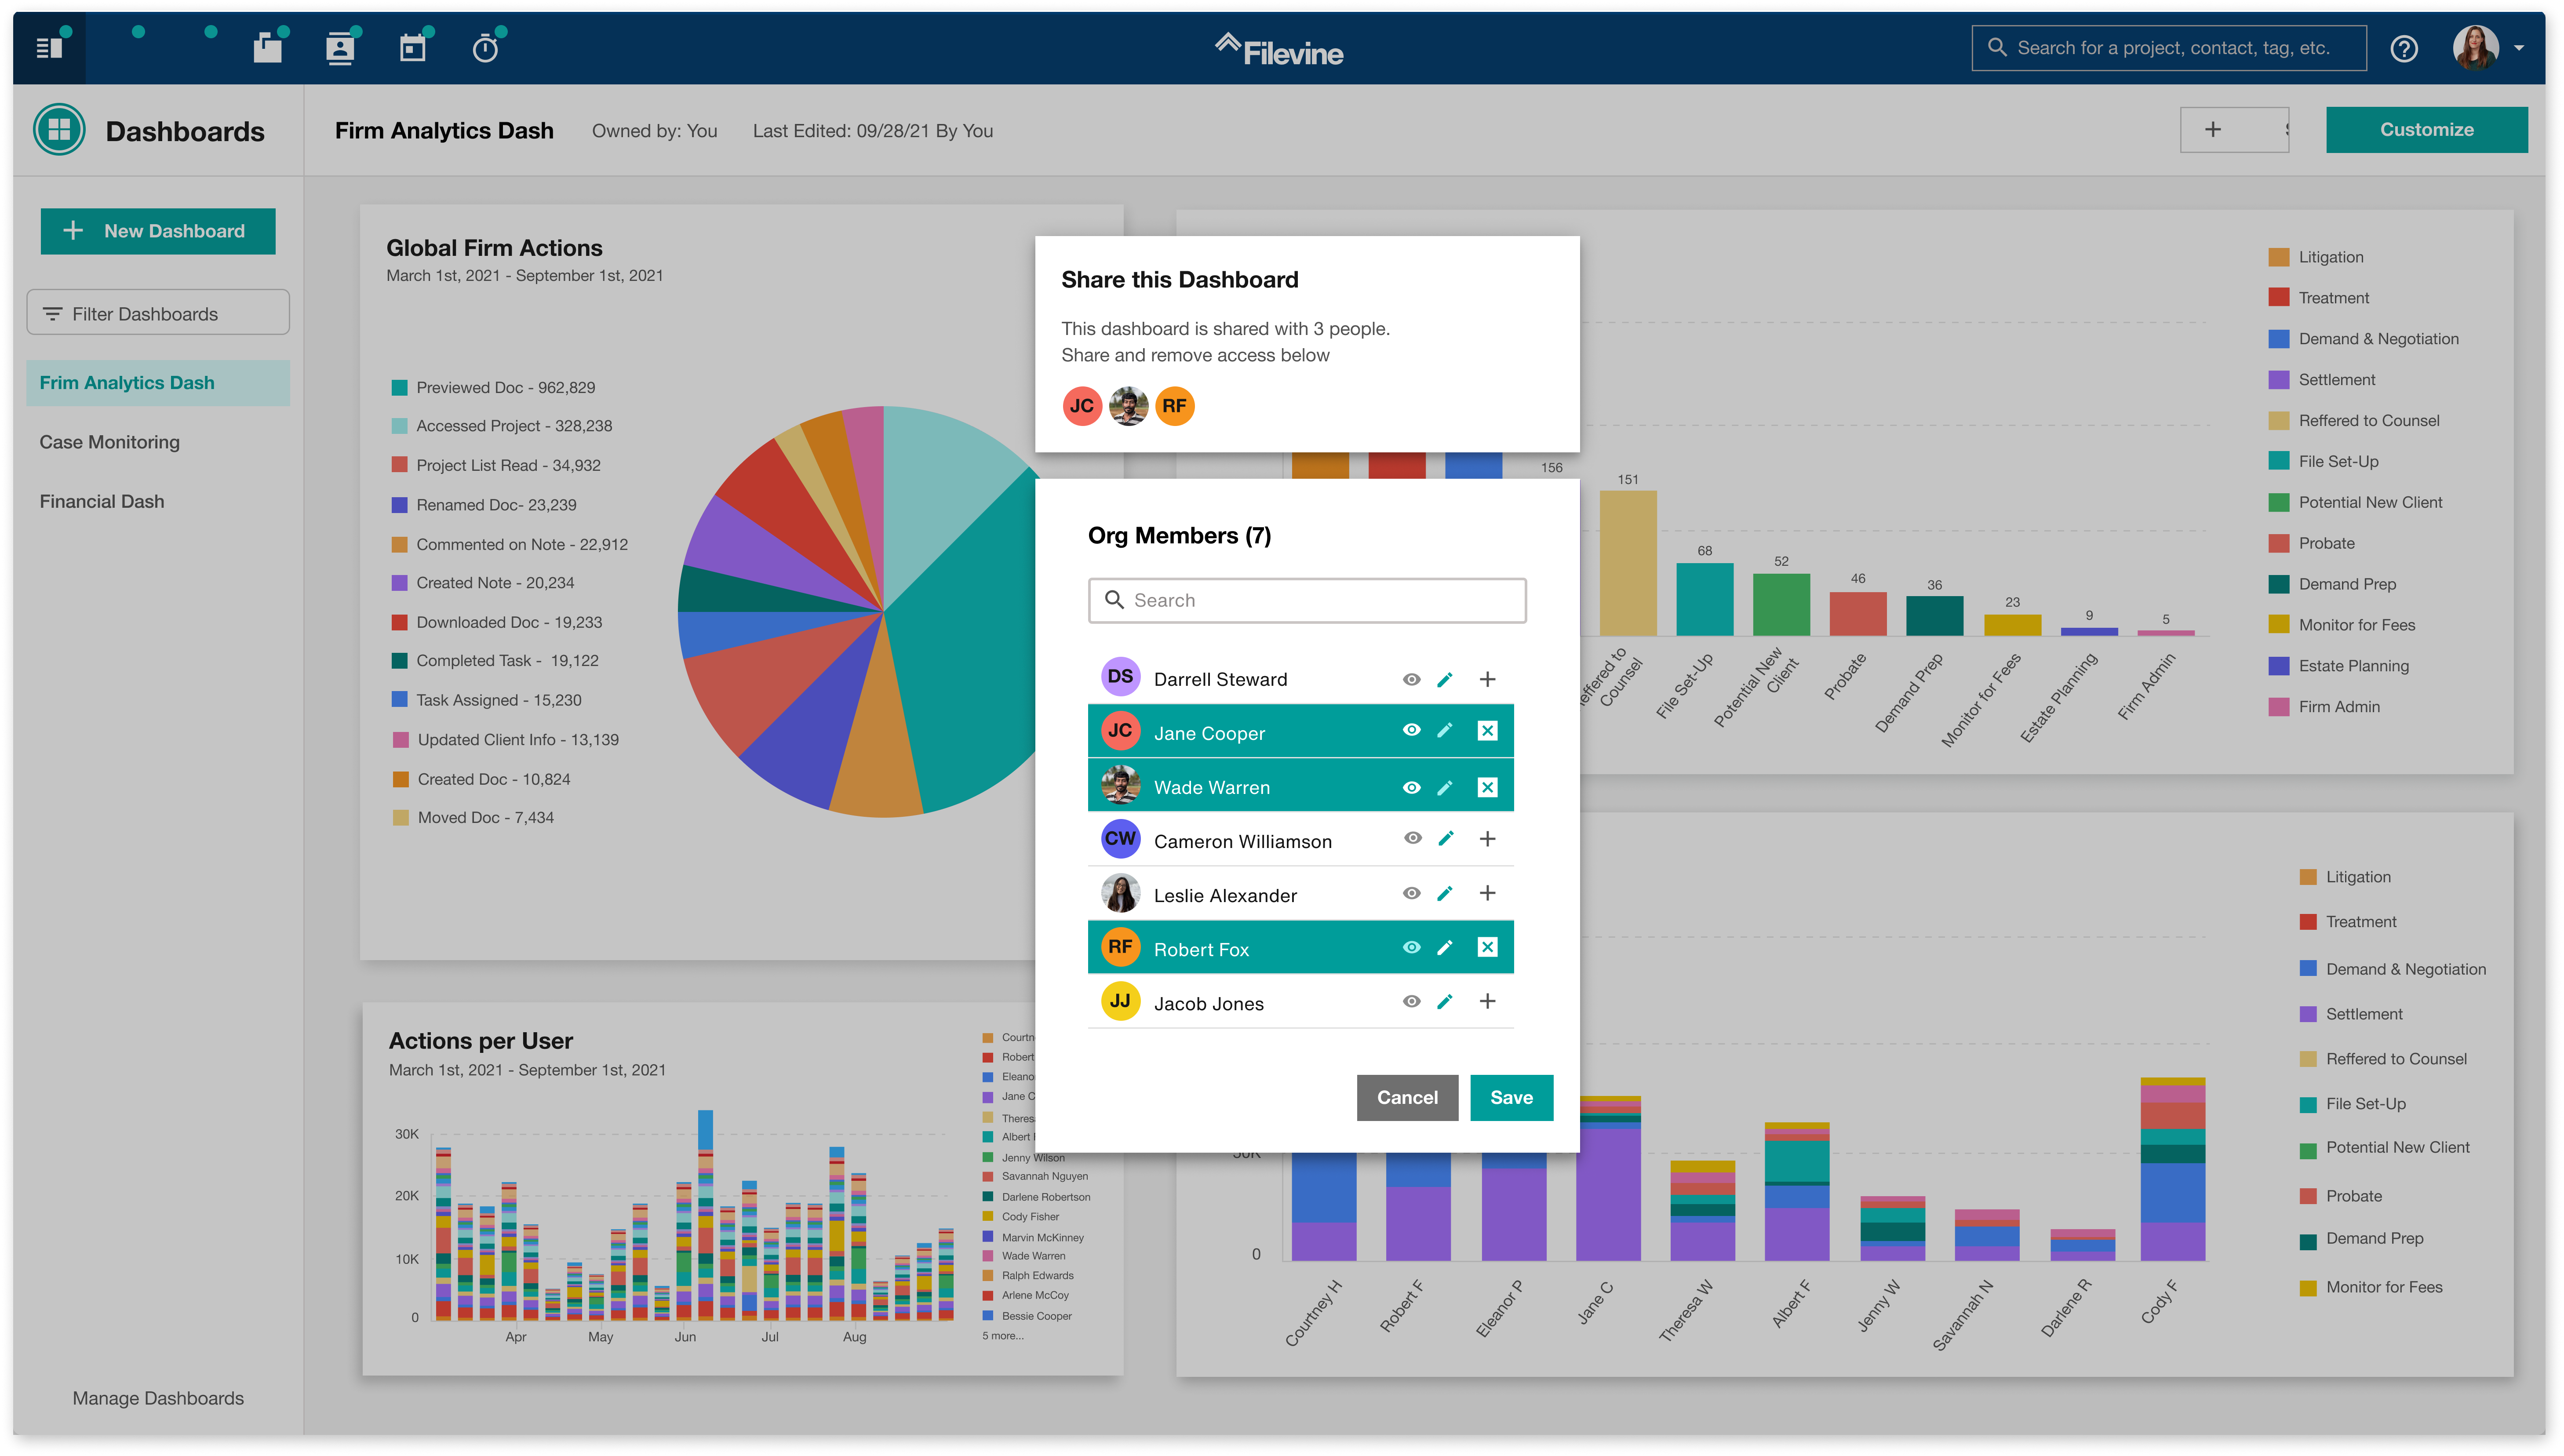
Share Dashboard Pop-up
Development
Collaborating with Developers
I worked extremely closely with the development team during this project. They were in the process of switching over component libraries from Svelte to the companies newly build Terrior Library. This meant there were lots of bumps in the road and they needed more guidance and collaboration.
Along with that challenge, we were also fighting the roadmap to finish this project and release the MVP. There was a shift in company priorities and the dev team working on this would be allocated to a different project. So we had to get the MVP out to users so we could start gathering data and prove its worth to stakeholders.
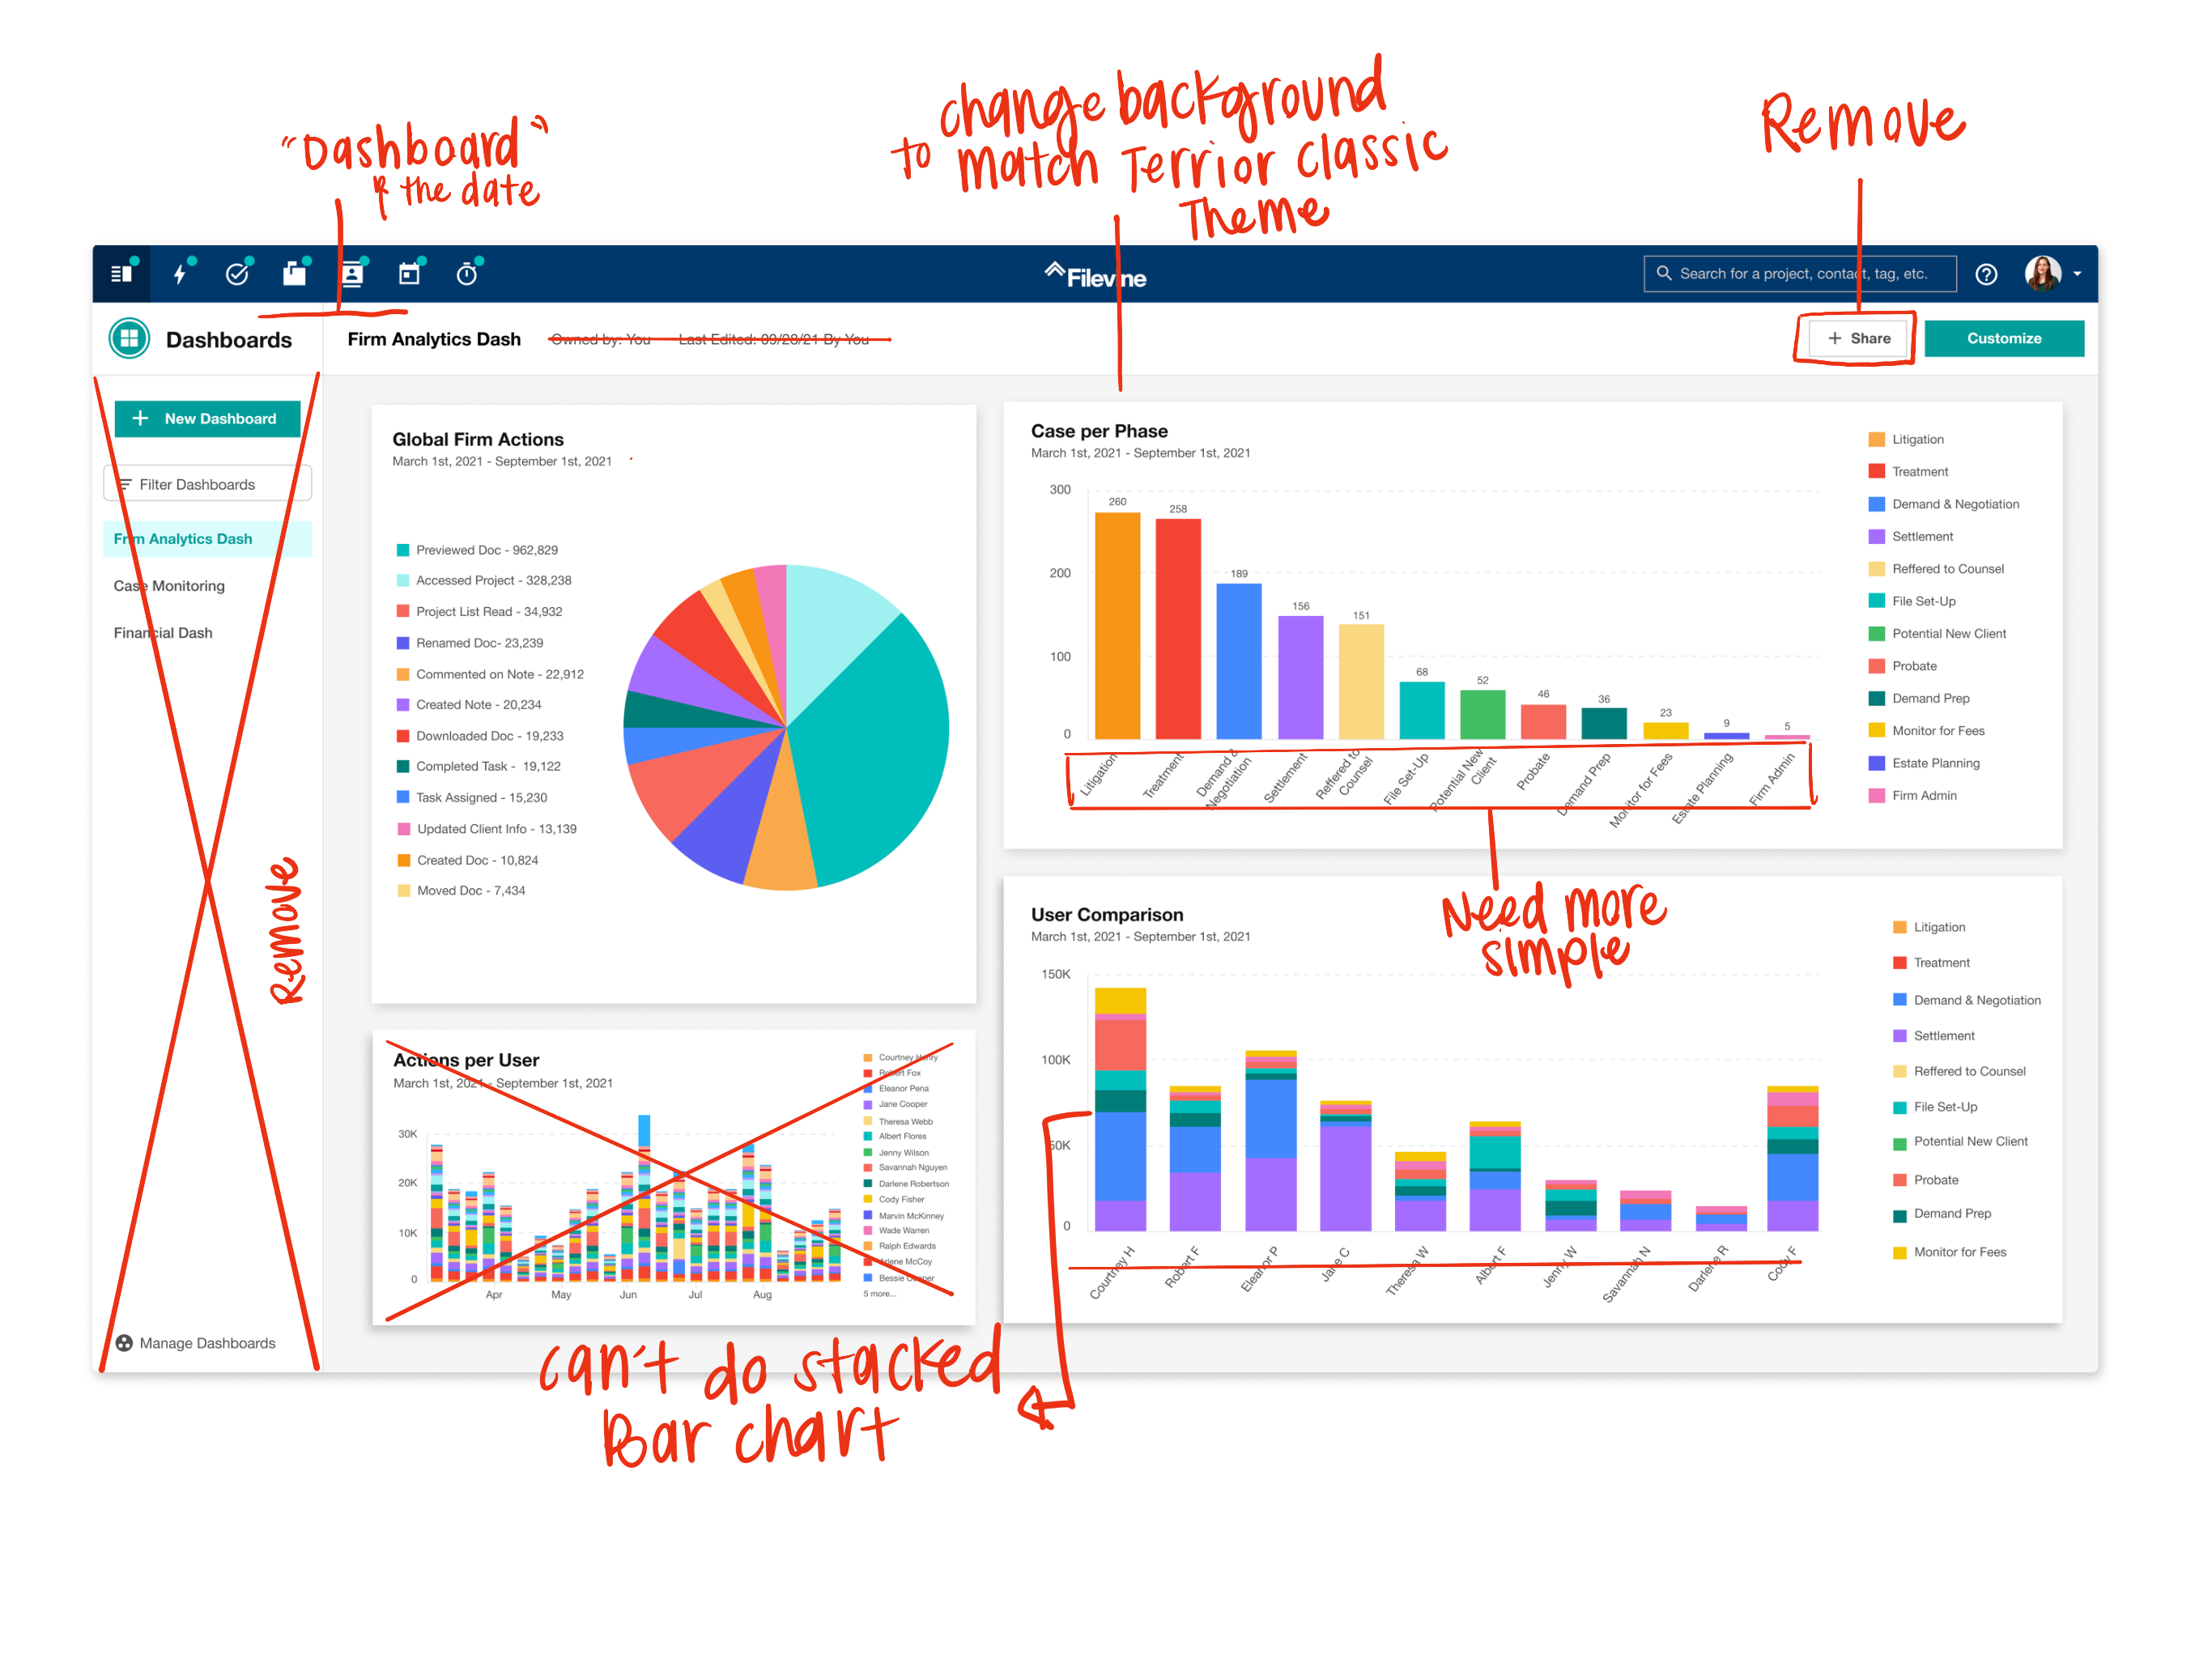
This meant certain things had to be cut and simplified.
Simplified
We cut back on the amount of widgets available for users because it was difficult to link certain data from different parts of the app. We also simplified the look & amount of data on the widgets and only offered 3 data visualization options.
Cut Completely
We cut out the share functionality completely. For MVP it wasn't applicable and it wasn't a number one priority. We also had to cut out the widget library for the MVP and decided it would be a version 2 concept. As well as the concept of having multiple dashboards.
MVP Solutions
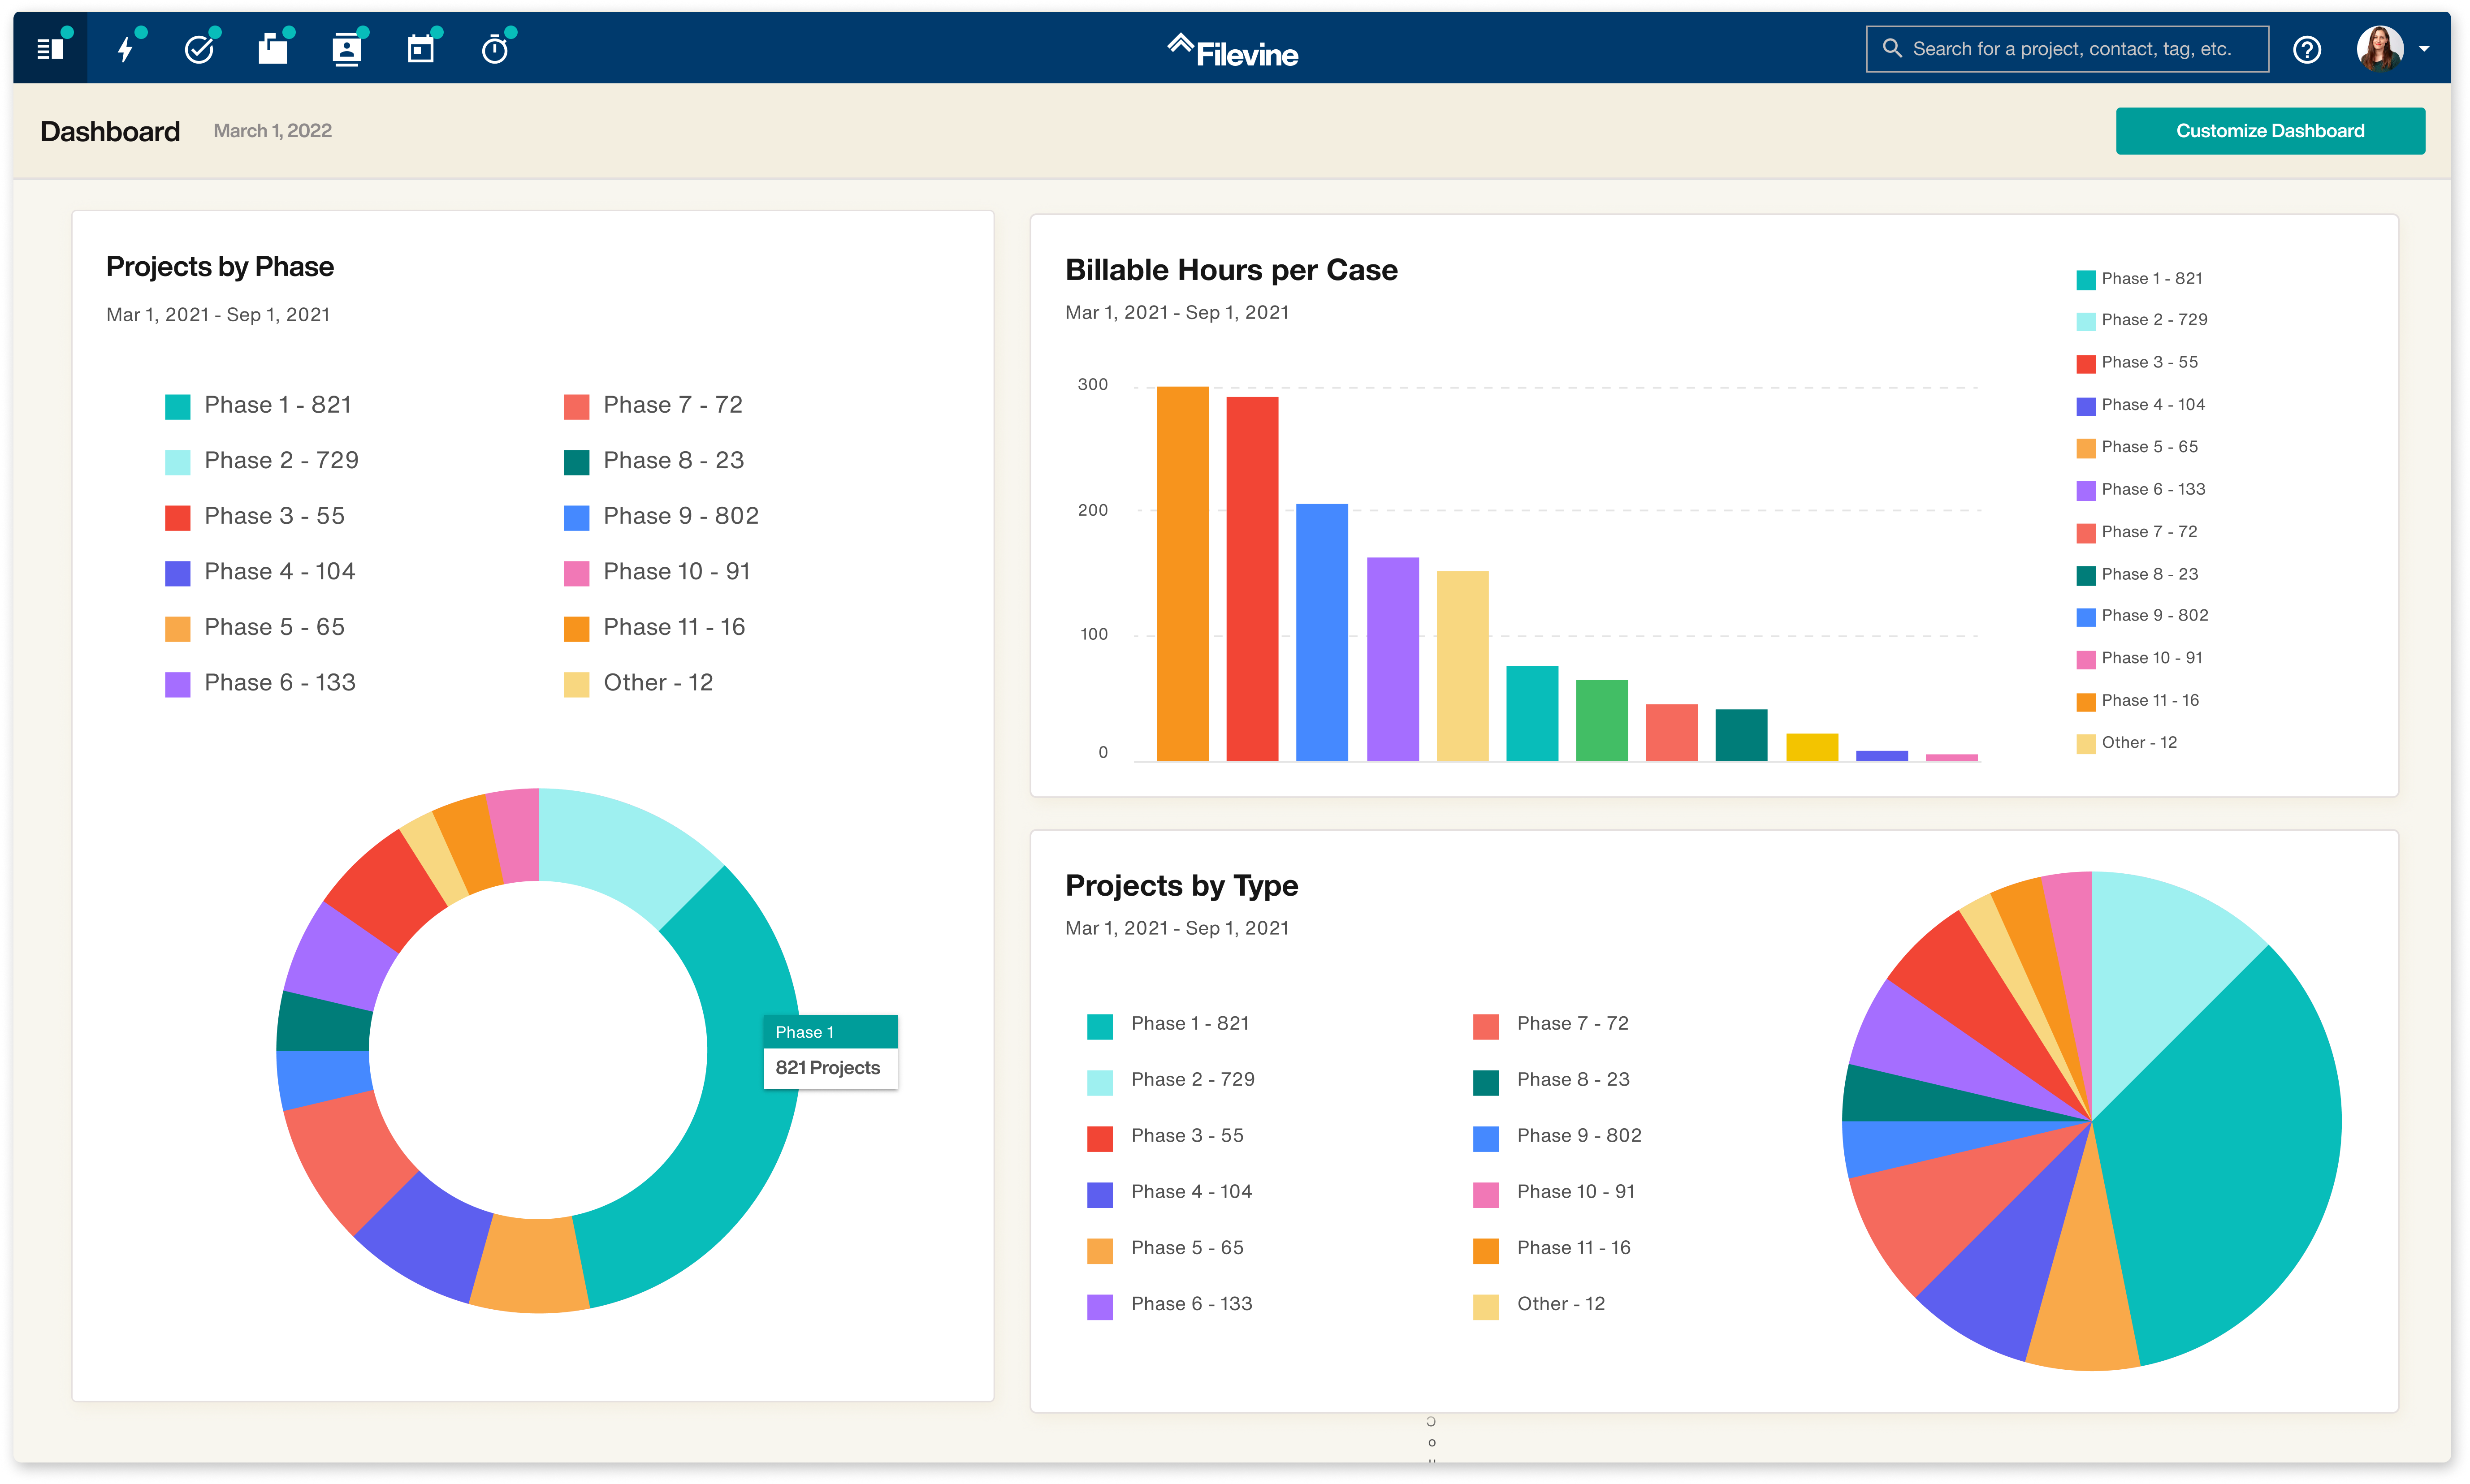
MVP Dashboard Homescreen
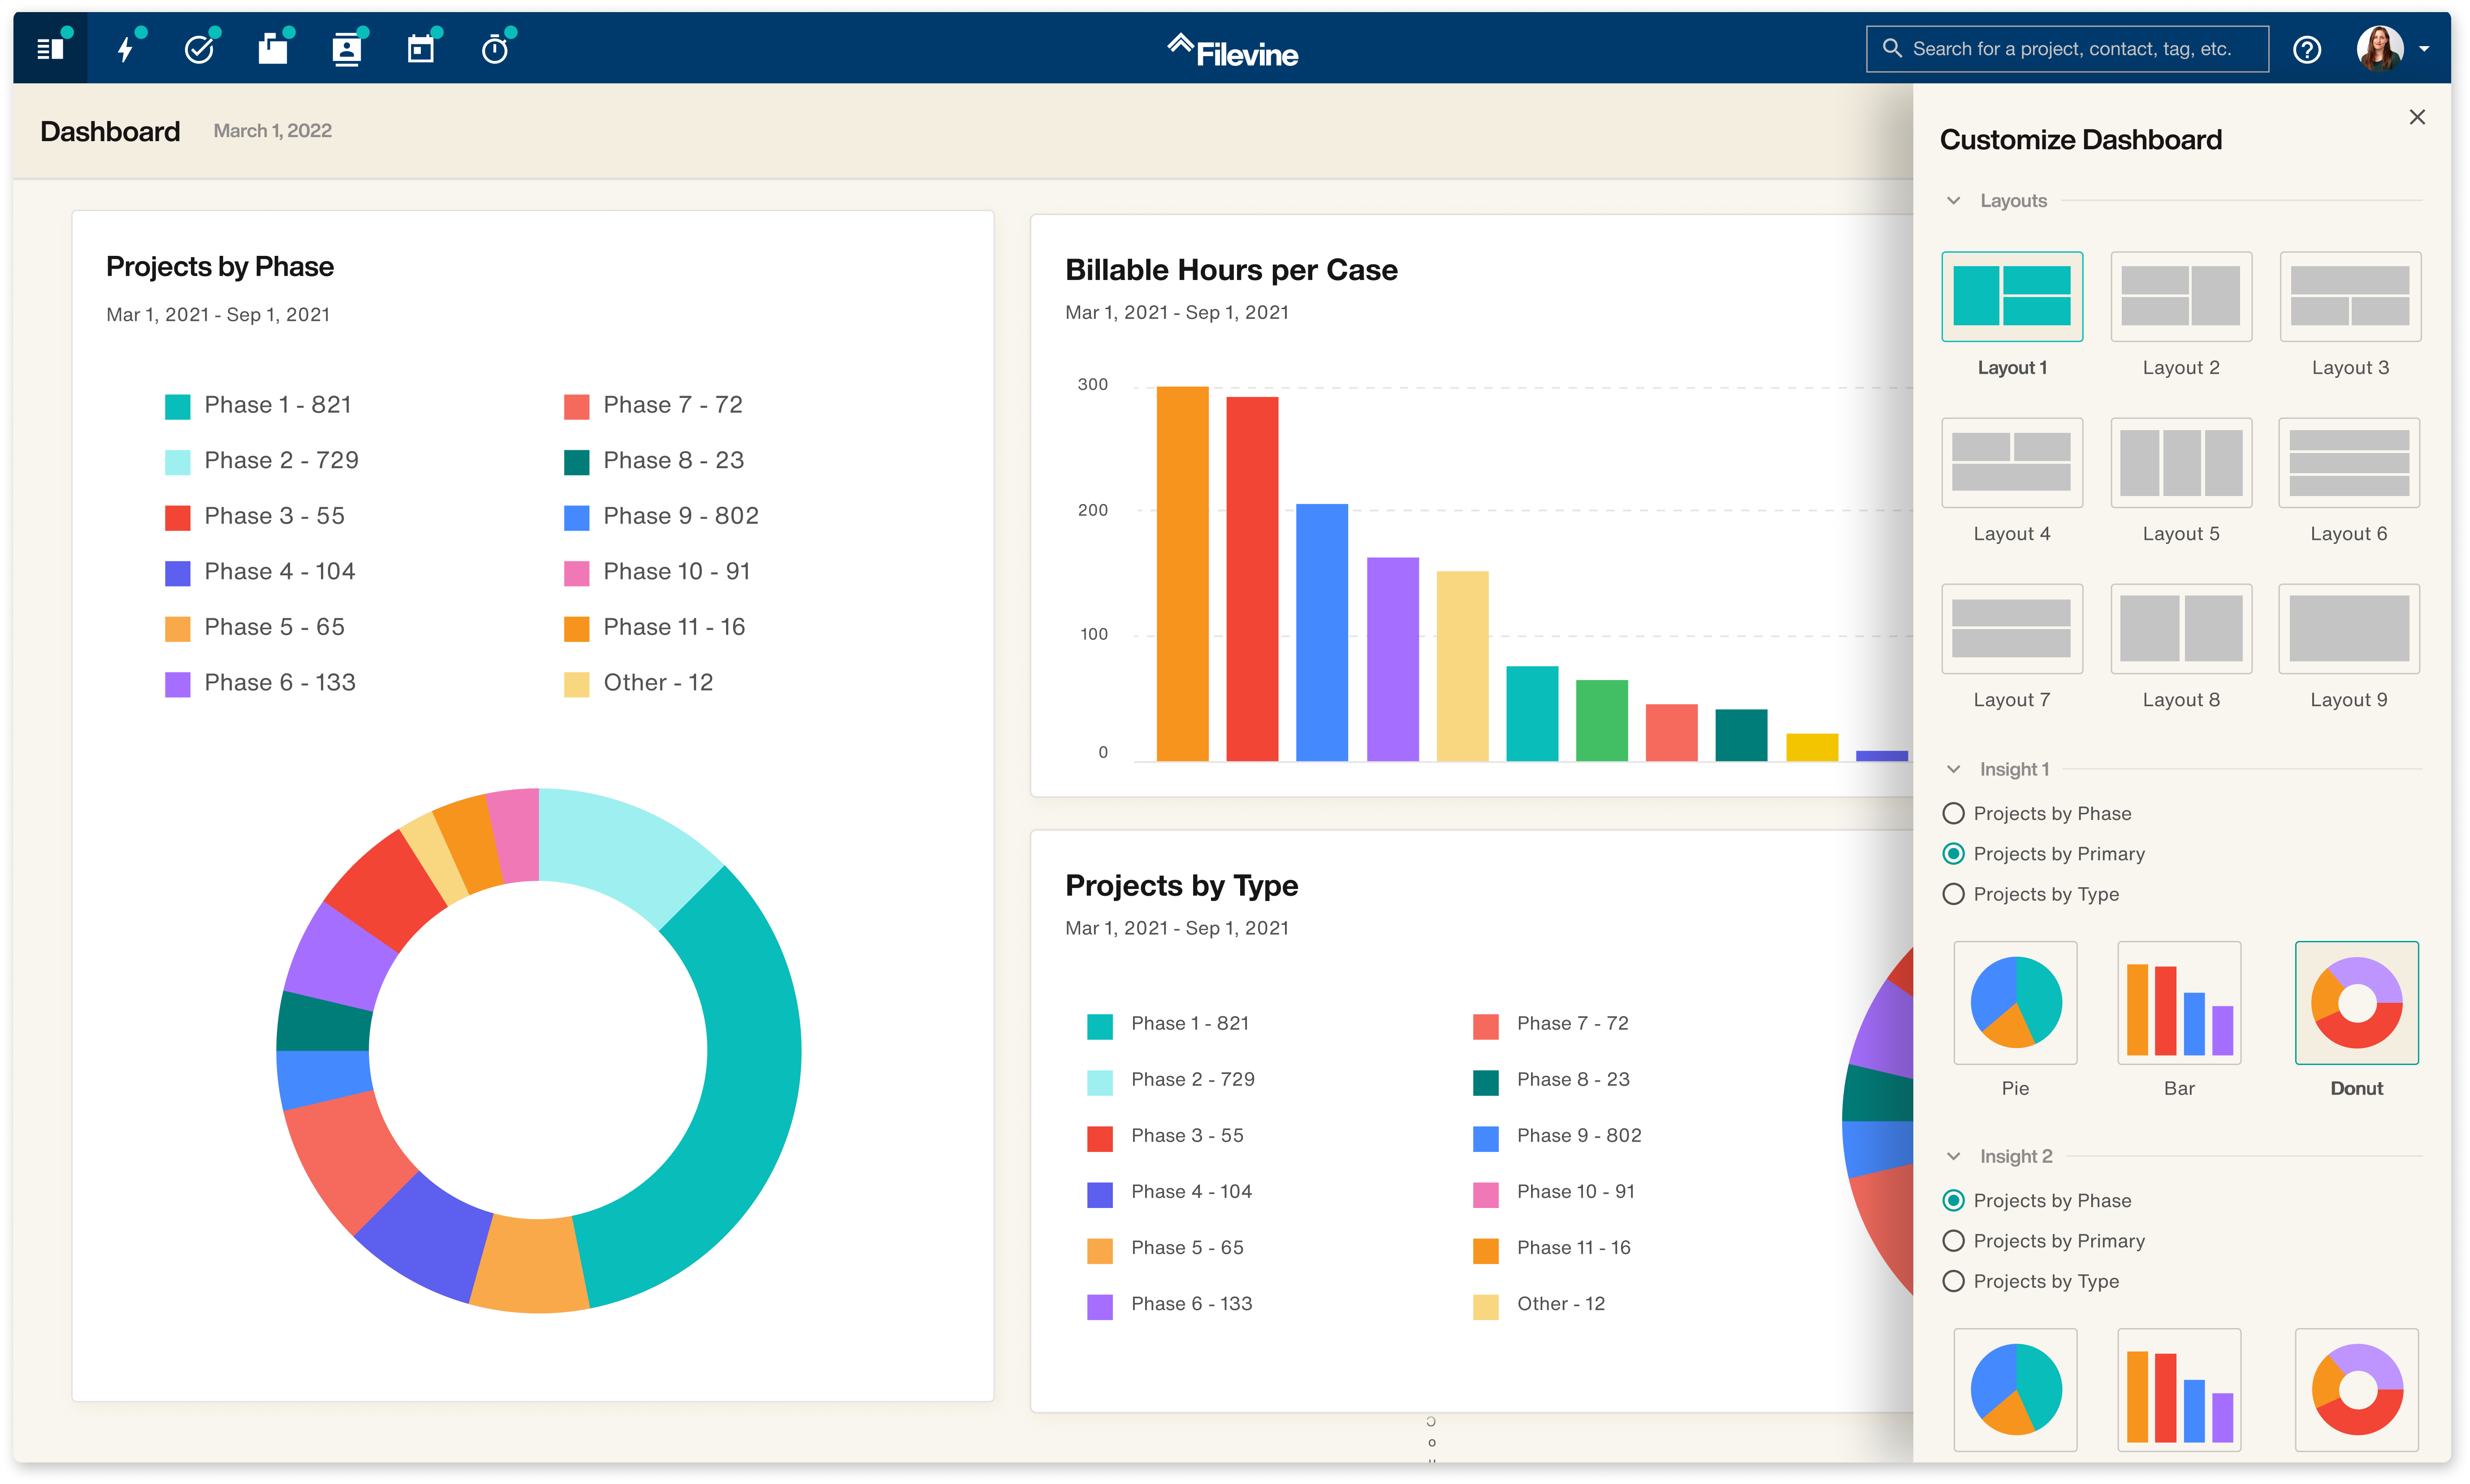
MVP Dashboard Customize & Configuration Panel
Next Steps & Room For Opportunities
Final Takeaways
The released version of the Dashboard has been well recieved, but there is so much room for improvement and future opportunities.
Tactical widgets are something that could truly improve users daily lives and workloads, while also giving the business a lucrative way to customize dashboards.
Drill down capabilities for analytical widgets would also be a great step towards being closer to parr with domo and other competitors.
Next Up: Design sprinting to a solution
Links
Made with love
©BrittanyKeller 2023